scikit-笔记:100问
Table of Contents
- 1. 100 QandA of sklearn
- 1.1. How to Generate Test Datasets in Python with scikit-learn
- 1.2. How to check the predict accuracy of classification or clustering
1 100 QandA of sklearn
1.1 How to Generate Test Datasets in Python with scikit-learn
- How to generate multi-class classification prediction test problems.
- How to generate binary classification prediction test problems.
- How to generate linear regression prediction test problems.
1.1.1 How to generate multi-class classification prediction test problems.
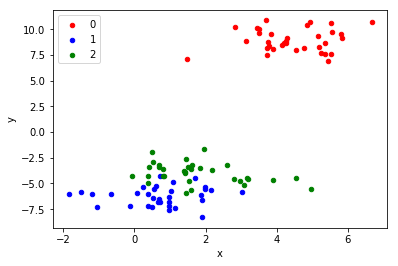
In this section, we will look at three classification problems: blobs, moons and circles.
1.1.1.1 Blobs Classification Problem
The make_blobs() function can be used to generate blobs of points with a
Gaussian distribution.
You can control how many blobs to generate and the number of samples to generate, as well as a host of other properties.
The problem is suitable for linear classification problems given the linearly separable nature of the blobs.
from sklearn.datasets.samples_generator import make_blobs
from matplotlib import pyplot
from pandas import DataFrame
# generate 2d classification dataset
X, y = make_blobs(n_samples=100, centers=3, n_features=2)
# scatter plot, dots colored by class value
df = DataFrame(dict(x=X[:,0], y=X[:,1], label=y))
colors = {0:'red', 1:'blue', 2:'green'}
fig, ax = pyplot.subplots()
grouped = df.groupby('label')
for key, group in grouped:
    group.plot(ax=ax, kind='scatter', x='x', y='y', label=key, color=colors[key])
pyplot.show()

1.1.1.2 Moons Classification Problem
from sklearn.datasets import make_moons
from matplotlib import pyplot
from pandas import DataFrame
# generate 2d classification dataset
X, y = make_moons(n_samples=100, noise=0.1) #<<<<-HERE
# scatter plot, dots colored by class value
df = DataFrame(dict(x=X[:,0], y=X[:,1], label=y))
colors = {0:'red', 1:'blue'}
fig, ax = pyplot.subplots()
grouped = df.groupby('label')
for key, group in grouped:
    group.plot(ax=ax, kind='scatter', x='x', y='y', label=key, color=colors[key])
pyplot.show()
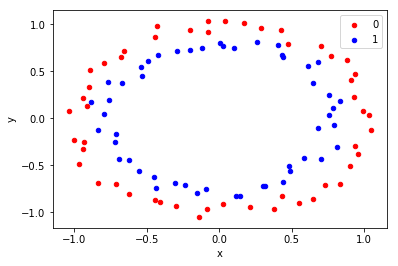
1.1.1.3 Circles Classification Problem
from sklearn.datasets import make_circles
from matplotlib import pyplot
from pandas import DataFrame

# generate 2d classification dataset
X, y = make_circles(n_samples=100, noise=0.05) #<<<<-HERE
# scatter plot, dots colored by class value
## create a pandas.DataFrame from a dict to store dataset
df = DataFrame(dict(x=X[:,0], y=X[:,1], label=y))
colors = {0:'red', 1:'blue'}
fig, ax = pyplot.subplots()
##
grouped = df.groupby('label')
print (type(grouped))
for key, group in grouped:
    group.plot(ax=ax, kind='scatter', x='x', y='y', label=key, color=colors[key])
pyplot.show()

1.1.2 How to generate linear regression prediction test problems.
Regression is the problem of predicting a quantity given an observation.
The make_regression() function will create a dataset with a linear relationship between inputs and the outputs.
from sklearn.datasets import make_regression
from matplotlib import pyplot
# generate regression dataset
X, y = make_regression(n_samples=100, n_features=1, noise=0.1)
# plot regression dataset
pyplot.scatter(X,y)
pyplot.show()
1.1.3 How to generate dataset from a curve with some noise
you must specify the parameter name — 'size' when using uniform distribution to generate noise
import numpy as np
rng = np.random.RandomState(42)
noise = rng.uniform(size=20)
noise
array([ 0.37454012,  0.95071431,  0.73199394,  0.59865848,  0.15601864,
0.15599452,  0.05808361,  0.86617615,  0.60111501,  0.70807258,
0.02058449,  0.96990985,  0.83244264,  0.21233911,  0.18182497,
0.18340451,  0.30424224,  0.52475643,  0.43194502,  0.29122914])
x = np.linspace(-3, 3, 100)
print(x)

rng = np.random.RandomState(42)
y = np.sin(4 * x) + x + rng.uniform(size=len(x))

plt.plot(x, y, 'o');
1.2 How to check the predict accuracy of classification or clustering
- from sklearn.metrics import confusion_matrix
- from sklearn.metrics import accuracy_score
- from sklearn.metrics import adjusted_rand_score
Unsupervised Learning Part 2 – Clustering comparing to true labels using confusion_matrix and accuracy_score comparing to true labels using adjusted_rand_score