lec 01 Introduction.
Table of Contents
lec 01 Introduction.
Introduction. Classification, training, and testing. Validation and overfitting. Read ESL, Chapter 1
人工智能核心理念
- 发现数据中的模式;使用它们进行预测。
- 模型和统计数据帮助我们理解模式。
- “学习”模式,优化算法。
这是最重要的部分数据。数据驱动一切。你不能学到很多东西,如果你没有足够的数据。你不能学到很多东西如果数据很差劲。但令人惊奇的你能做什么如果你有很多很好的数据。机器学习有了很大的变化在过去的十年中,因为互联网上有真正的大量的数据。例如,只要有点耐心可以下载数以百万计的照片。然后你就可以建立一个三维模型的巴黎。 一些技术已经失宠,如神经网络、有回来大在过去的几年里,因为研究人员发现,他们工作得更好当你有大量的数据。
EXAMPLE: CLASSIFYING DIGITS
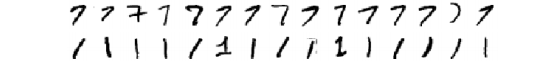
- 收集培训图片:例如7和7位数不
- 这些图像表示为向量
               |-3-|
               | 3 |
               | 3 |
               | 3 |
---------      | 0 |                          As a general rule in machine learning,
|3|3|3|3|      | 0 |                  /---->  you get some data, you image each data   -------+
---------      | 2 |                 /        as _a point in high dimension space_            |
|0|0|2|3|      | 3 |                /                                                         |
---------  ->  | 0 | -> 16 dimension space    Now you have bunch of points in 16 dimension  <-+
|0|0|1|3|      | 0 |                          you want to know is there some structure, like
---------      | 1 |                          can we buid a 'wall' that all the '7' in onside
|3|3|3|3|      | 3 |                          all the '1' in another.
---------      | 3 |
               | 3 |
               | 3 |
               |-3-|
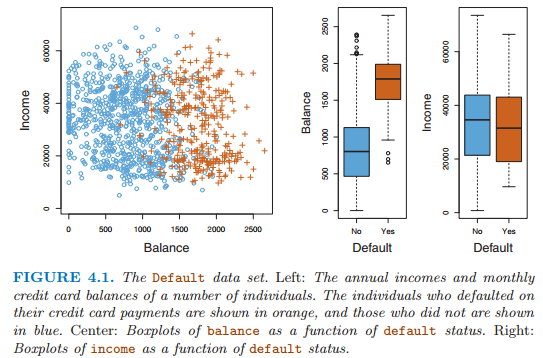
The problem of classification. We are given data points, each belonging to one of two classes. Then we are given additional points whose class is unknown, and we are asked to predict what class each new point is in. Given the credit card balance and annual income of a cardholder, predict whether they will default on their debt
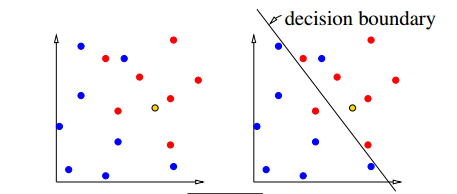
[Draw 2 colors of dots, almost but not quite linearly separable.] ["How do we classify a new point?" Draw a third color point.] [One possibility: look at nearest neighbor.] [Another possibility: draw linear "decision boundary"; label it.] [Those are two different models for the data]
[Slide: nearest neighbor classifier and linear classifier.]
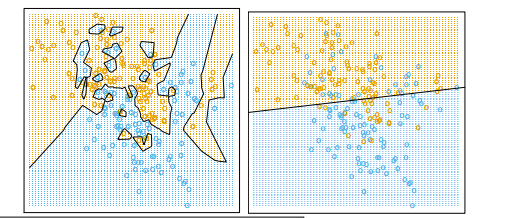
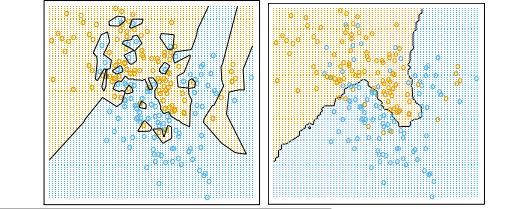
The left figure has a big advantage: it classifies all the test data correctly, whereas the right figure does not. But the right figure has an advantage too. Somebody please tell me what.
The left figure is an example of what's called "overfitting." In the left figure, observe how intricate the decision boundary is that separates the positive examples from the negative examples. It's a bit too intricate to reflect reality. In the right figure, the decision boundary is smoother. Intuitively, that smoothness is probably more likely to correspond to reality.]
Validation
2 sets
- Train a classifier: it learns to distinguish 7 from not 7
- Test the classifier on NEW images
2 error
2 kinds of error:
- Training set error: The linear classifier doesn't classify all 7's / not 7's correctly
- Test set error: Try out new images, not used during training. Some of them might be classified wrong.
2 kinds bad sample
outliers: samples whose labels are atypical (e.g. solvent borrower who defaulted anywA Simple Classifieray). overfitting: when the test error deteriorates because the classifier becomes too sensitive to outliers or other spurious patterns.
[In machine learning, the goal is to create a classifier that generalizes to new examples we haven't seen yet. Overfitting is counterproductive to that goal. So we're always seeking a compromise between decision boundaries that make fine distinctions and decision boundaries that are downright superstitious.]
[When I underline a word or phrase, that usually means it's a definition. If you want to do well in this course, my advice to you is to memorize the definitions I cover in class.]
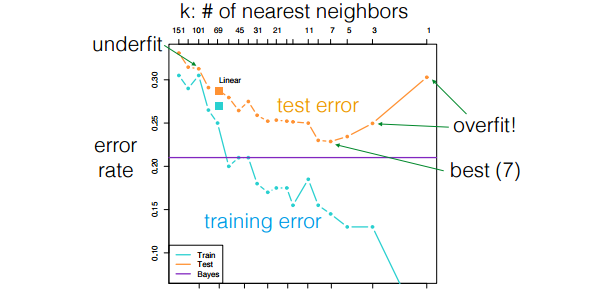
hyperparameters
Most ML algorithms have a few hyperparameters that control over/underfitting, e.g. k in k-nearest neighbors. We select them by
2+1 data sets, validation
validation:
- Hold back a subset of training data, called the validation_set.
- Train the classifier multiple times with different hyperparameter settings.
- Choose the settings that work best on validation set.
Now we have 3 sets: training_set used to learn model weights validation_set used to tune hyperparamters, choose among different models test_set used as FINAL evaluation of model. Keep in a vault. Run ONCE, at the very end. [It's very bad when researchers in medicine or pharmaceuticals peek into the test set prematurely!]
kaggle.com
Kaggle.com: runs ML competitions, including our HWs we use 2 test sets: "public" set results available during competition "private" set revealed only after due date [If your public results are a lot better than your private results, we will know that you overfitted.]
Techniques [taught in this class, NOT a complete list]
Supervised learning:
- Classification: is this email spam?
- Regression: how likely does this patient have cancer?
Unsupervised learning:
- Density estimation: what is probability density function of rainfall?
- Clustering: which DNA sequences are similar to each other?
- Dimensionality reduction: what are common features of faces? common differences?
[Show slides with examples of:
- Classification
- Regression
- Density estimation
- Clustering
- Dimensionality reduction
]