lec 02 Classifiers
Table of Contents
lec 02 Classifiers
Linear classifiers. Predictor functions and decision boundaries. The centroid method. Perceptrons. Read parts of the Wikipedia Perceptron page. Read ESL, Section 4.5–4.5.1
Classifiers
Sample, Feature(dimension), Class def
You are given a data set of n samples, each with d features. d features = d dimensional space. we're going to represent each sample as a point in d dimensional space. Some samples belong to class O; some do not.
Representation of an example
Example: Samples are bank loans Features are income & age (d = 2) Some are in class "defaulted", some are not
Goal: Predict whether future borrowers will default, based on their income & age.
basic concepts of ML def
Sample, Point, Feature_vector, Predictor, Independent_var Represent each sample as a point in d-dimensional space, called a feature_vector (aka predictors, independent_variables).
an example of 2 feature classifier
        ^                        ^                        ^    _overfitting_
        |  X     X X             |  X     X O             |  X  O  O X
        |    X   X               |    X   X               |    X   X
        | O       X              | O       O              | X       O
income  |O     X         income  |O     X         income  |O     X
        |    O   X               |    O X O               |    O   X
        | O    O   X             | O    O   O             | X    O   X
        | O       O              | O       O              | O       O
        +----------->            +----------->            +----------->
        age                      age                      age
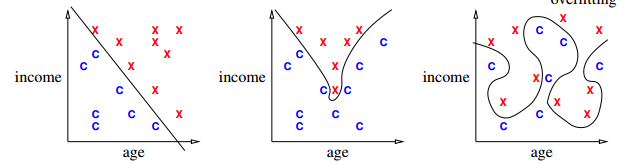
[Draw lines/curves separating O's from X's. Use those curves to predict which future borrowers will default.]
Decision Boundary def
decision boundary: the boundary chosen by our classifier to separate items in the class from those not.
[By the way, when I underline a word or a short phrase, usually that is a definition. If you want to do well in this course, you should memorize all the definitions I write down.]
Predictor/Decision/Discriminant Function def
Some (not all) classifiers work by computing a
_predictor function_:  A function f(x) that maps a sample point x to

a scalar such that
f(x) >  0     if x is in class O;
f(x) <= 0     if x not in class O.
Aka _decision_function_ or _discriminant_function_.
For these classifiers, the decision boundary is {x ∈ R^d : f(x) = 0} [That is, the set of all points where the prediction function is zero.] Usually, this set is a (d - 1) dimensional surface in R^d space.
Isosurface,Isovalue,Isocontour def
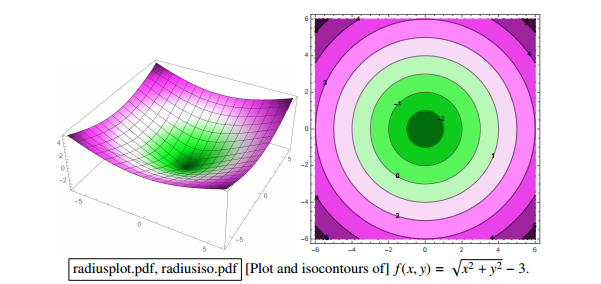
{x : f(x) = 0} is also called an isosurface of f for the isovalue 0.
f has other isosurfaces for other isovalues, e.g. {x : f(x) = 1}.
[Show plot & isocontours of sqrt(x^2 + y^2) - 3. Imagine a function in R^d, and imagine its (d - 1)-dimensional isosurface.]
 left is sample space of 3-dimensional space
right picture is a set of circular 'cake' which means 2-dimension isosurface with different radius
但是更多时候,我们会有很多 feature,也就是很多维度的向量,each feature 1 dimension.
比如处理图像,一张 4pixel × 4pixel 图像就是 16-dimension feature-vector(有一个 15-dimensional surface),
each pixel may have 6 bytes space to represent different color. it is huge dimensional space.
left is sample space of 3-dimensional space
right picture is a set of circular 'cake' which means 2-dimension isosurface with different radius
但是更多时候,我们会有很多 feature,也就是很多维度的向量,each feature 1 dimension.
比如处理图像,一张 4pixel × 4pixel 图像就是 16-dimension feature-vector(有一个 15-dimensional surface),
each pixel may have 6 bytes space to represent different color. it is huge dimensional space.
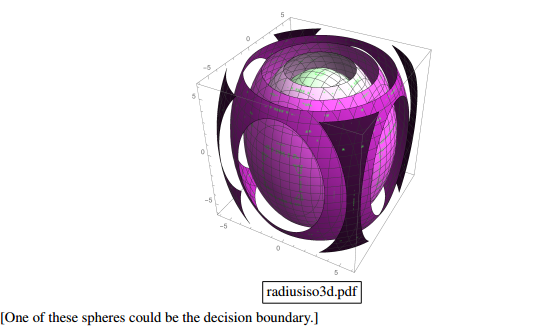
this is another 3-dimensional sample space, each isosurface would look like an ellipsoid(but,still is a 2-dimensional surface) in 3-dimensional space
Linear Classifier def
linear classifier: The decision boundary is a hyperplane. Usually uses a linear predictor function. [Sometimes no predictor fn.]
Overfitting def
overfitting: When sinuous decision boundary fits sample data so well that it doesn't classify future items well.
Math Review
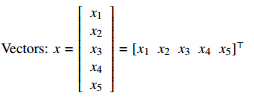
Vectors:
[I will write vectors in matrix notation.]
    -   -
    |x_1|
    |x_2|                        T
x = |x_3| = [x_1 x_2 x_3 x_4 x_5]
    |x_4|
    |x_5|
    -   -
Think of x as a point in 5-dimensional space.
Conventions of symbol
Conventions (often, but not always):
uppercase roman = matrix or random variable   X
lowercase roman = vector                      x
Greek = scalar                                alpha
Other scalars:                                n = # of samples
                                              d = # of features (per sample)
                                                = dimension of sample points
                                              i j k = indices
function (often scalar)                       f( ), s( ), ...
Inner product: Linear fn
inner_product (aka dot_product):
x . y = x_1 y_1 + x_2 y_2 + ... + x_d y_d

                                T
_Matrix notation_ also written x  y

Clearly,  f(x) = w . x + alpha  is a _linear_function_ in x.
Inner product: Euclidean norm, Normalize
Euclidean_norm:
|x| = sqrt(x . x) = sqrt(x_1^2 + x_2^2 + ... + x_d^2) |

|x| is the length (aka Euclidean length) of a vector x.

                   x
Given a vector x, --- is a _unit_ vector (length 1).
                  |x|
                                           x
"_Normalize_ a vector x":  replace x with ---.
                                          |x|
Inner product: Compute angle
Use dot products to compute angles:

      x
     /                       x . y     x     y
    /           cos theta = ------- = --- . ---
   / theta                  |x| |y|   |x|   |y|
  ---------->                        \___/ \___/
                                  length 1 length 1

      x   acute                ^     right       x        obtuse
     /     +ve                 |       0          \         -ve
    /                          |_                  \
   /                           | |                  \
  ---------->                  +----------->         --------------->
  cos theta > 0                cos theta = 0         cos theta < 0
Predictor fn: Hyperplane,
Given a linear predictor function f(x) = w . x + alpha, the decision boundary is like
Predictor fn = 0;
f(x) = 0;
w . x + alpha = 0;
H = {x : w . x = - alpha};
The set H is called a hyperplane. (a line in 2D, a plane in 3D.)
[I want you to understand what a hyperplane is. In 2D, it's a line. In 3D, it's a plane. Now take that concept and generalize it to higher dimensions. In d dimensions, a hyperplane is a flat, infinite thing with dimension d - 1. A hyperplane divides the d-dimensional space into two halves.]
Hyperplane: Normal vector
Theorem:
Let xy be a vector that lies on H.  Then w . (y - x) = 0.
Proof:
x and y lie on H.  Thus w . (x - y) = - alpha - (- alpha) = 0.

w is called the _normal_vector_ of H,
because (as the theorem shows) w is normal (perpendicular) to H.
(I.e. w is normal to every pair of points in H.)
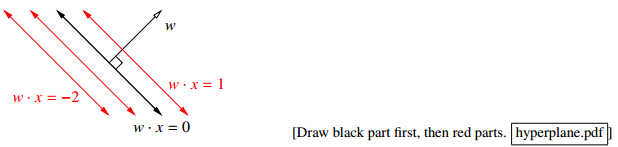
Normal vector: Signed Distance
If w is a unit vector, then w . x + alpha is the signed_distance from x to H. I.e. it's the distance, but positive on one side of H; negative on other side. 这个很好理解,对于一个平面和一个点,我如何求这个点到这个平面的距离呢?我首先求这个平面的垂直向量,然后连线这个点与原点,这条线会穿过这个平面形成一个交点。这个点与交点之间的线段在这个垂直向量上的映射就是这个点到这个平面的距离。
或者这样理解,函数 w.x = y
当 w.x = y 在 2 维时,w.x=常量 是一条线;
当 w.x = y 在 3 维时,w.x=常量 是一个面;
按照'上加下减,左加右减'的原则
w.x=0 形成的平面 向上平移 1 变成 w.x=1
w.x=0 形成的平面 向下平移 1 变成 w.x=-1
所以 signed distance of x' to H(因为通过升维法,H 始终可以表示为 w.x=0), 就是 H 经过平移 alpha 距离得到的平面 H' 恰好包含 x'
Moreover, the distance from H to the origin is alpha. [How do we know that?]
Hence alpha = 0 if and only if H passes through origin.
[w does not have to be a unit vector for the classifier to work. If w not unit vector, w . x + alpha is a multiple of signed distance. If you want to fix that, you can rescale the equation by computing |w| and dividing both w and alpha by 1 / |w|.]
Signed Distance: Weight
The coefficients in w, plus alpha, are called weights or sometimes regression_coefficients.
[That's why I named the vector w; "w" stands for "weights".]
The input data is linearly_separable if there exists a hyperplane that separates all the samples in class O from all the samples NOT in class O.
[At the beginning of this lecture, I showed you one plot that's linearly separable and two that are not.]
[We will investigate some linear classifiers that only work for linearly separable data, then we'll move on to more sophisticated linear classifiers that do a decent job with non-separable data. Obviously, if your data is not linearly separable, a linear classifier cannot do a perfect job. But we're still happy if we can find a classifier that usually predicts correctly.]
A Stupid Classifier
Centroid method
compute mean mu_C of all vectors in class O and mean mu_X of all vectors NOT in O.
We use the predictor function
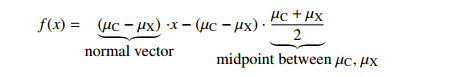
                                            mu_C + mu_X
f(x) = (mu_C - mu_X) . x - (mu_C - mu_X) . (-----------)
                                                 2

       \___________/                       \___________/
       normal vector                 midpoint between mu_C, mu_X
so that decision boundary is the hyperplane that bisects line segment w/endpoints mu_C, mu_X.
[Better yet, we can adjust the right hand side to minimize the number of misclassified points. Same normal vector, but different position.]
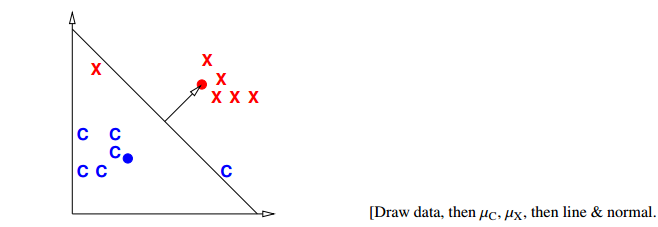
[In this example, there's clearly a better linear classifier that classifies every sample correctly. Note that this is hardly the worst example I could have given. If you're in the mood for an easy puzzle, pull out a sheet of paper and think of an example, with lots of samples, where the centroid method misclassifies every sample but one.] Only better for Gaussian distribution [Nevertheless, there are cases where this method works well, like when all your positive examples come from one Gaussian distribution, and all your negative examples come from another.]
Perceptron Algorithm
(Frank Rosenblatt, 1957)
Slow, but correct for linearly separable samples. Uses a numerical_optimization algorithm, namely, gradient_descent.
Key questions of Numerical Optimization
How many of you know what numerical optimization is? How many of you know what gradient descent is? How many of you know what Lagrange multipliers are? How many of you know what linear programming is? How many of you know what the simplex algorithm for linear programming is? How many of you know what convex programming is?
We're going to learn what all these things are. As machine learning people, we will be heavy users of all the optimization methods. Unfortunately, I won't have time to teach you algorithms for all these optimization problems, but we'll learn a few, and I'll give you some hints how the other algorithms work.
Represent a sample: a row of features
一行就是一个 sample,一列就是一种 feature。
        feature1  feature2 feature3 feature4 feature5
        +--------+--------+--------+--------+--------+
sample1 |        |        |        |        |        |
  X_1   |        |        |        |        |        |
        +--------+--------+--------+--------+--------+
sample2 |        |        |        |        |        |
  X_2   |        |        |        |        |        |
        +--------+--------+--------+--------+--------+
sample3 |        |        |        |        |        |
  X_3   |        |        |        |        |        |
        +--------+--------+--------+--------+--------+
sample4 |        |        |        |        |        |
  X_4   |        |        |        |        |        |
        +--------+--------+--------+--------+--------+
sample5 |        |        |        |        |        |
  X_5   |        |        |        |        |        |
        +--------+--------+--------+--------+--------+

[The reason I'm using capital X here is because we typically store these vectors as rows of a matrix X. So the subscript picks out a row of X, representing a specific sample. When I want to pick out one feature from a sample, I'll add a second subscript after the first one.]
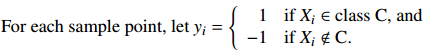
Represent Label
For simplicity, consider only decision boundaries that pass through the origin.
(We'll fix this later.) ~~~~~~~~~~~~~~~~~~~~~
Goal: find weights w
That is, if sample 'i' is in class 'O', then we want a positive signed distantce to that point from the hyperplane; else, we want a negative one.

Get constraint for optimization
A trick make 2 inequation to 1 inequation.

constraint 是把一个 machine learning problem 转化为 optimization problem 问题的前提
Define Loss function
Define the loss_function
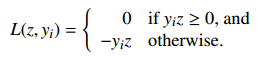
- yi is our prediction;
- z is correct classification.
注意 if y_i z < 0 那么 -y_i z > 0 的, 所以这个 loss fn 是越接近于 0 越好,如果是正值且很大说明不好,分的不是很理想。
[Here, z is the classifier's prediction, and y_i is the correct answer.]
Idea: if z has the same sign as y_i, the loss function is zero (happiness). But if z has the wrong sign, the loss function is positive.
[For each sample, you want to get the loss function down to zero, or as close to zero as possible. It's called the "loss function" because the bigger it is, the bigger a loser you are.]
Define risk function
risk 是标准浮动的空间, 简单说 R(w) = sum(L(测,真)) loss 是测试结果和现实情况之间的误差度量,如果结果都在 hyperplane 同一边,L(测,真) = 0; 如果结果分在 hyperplane 的两边,L(测,真) = -yi*z. = -(X_i.w)*z
Idea: We define a risk_function R that is positive if some constraints are violated.
Then we use optimization to choose w that minimizes R.
Define risk_function (aka objective_function or cost_function)
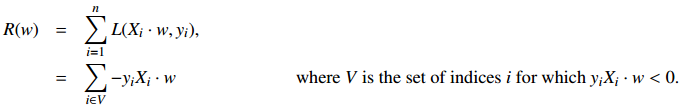 可以看到,constraint fn 与 risk fn 在这里会师了。
R(w) = SUM(constraint violated)
Min( R(w) ) = Min( SUM(constraint violated)) <- this is our target
可以看到,constraint fn 与 risk fn 在这里会师了。
R(w) = SUM(constraint violated)
Min( R(w) ) = Min( SUM(constraint violated)) <- this is our target
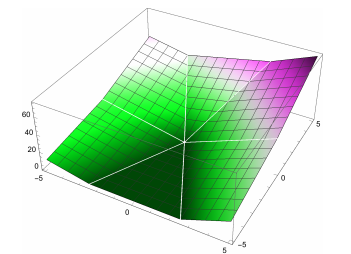 Plot of risk R(w). Every point in the dark green flat spot is a minimum.
We’ll look at this more next lecture
Plot of risk R(w). Every point in the dark green flat spot is a minimum.
We’ll look at this more next lecture
If w classifies all the points X_1, ..., X_n correctly, then R(w) = 0. Otherwise, R(w) is positive, and we want to find a better value of w.
--------------------------------------------------------------------------
| Goal:  Solve this _optimization_problem_:  find w that minimizes R(w). |
--------------------------------------------------------------------------
Summarize
Through the semester what you're often going to do is take some complex machine learning problem and reduce it to an optimazation problem which you can throw a well known mathmatical tech.