Tensorboard 的使用
Table of Contents
1 Tensorflow_4_Tensorboard
epoch_decay learning rate. 随着epoch次数逐渐减小的 learning rate 防止出现 learning rate [步幅过大] 不断从最低点跨过(从左跨到右,又从右跨到左)的情况出现.
learning rate 可以设置为一个 Variable, 然后在每次 epoch 开始时, 通过
tf.run(tf.assign(lr, lr_init*(0.95**epoch))) 来更新.
2 Tensorboard 显示网络结构
代码架构
<<包导入>>

<<数据准备>>
# numpy构造(with/without noise)
# 从已有数据集导入内存

<<图参数>>
# 批次大小, 批次数量
# dropout 保留率
<<图构造>>
# 一模: NN layers, name_scope for TB
# 两函: err fn(单点错误), loss fn(整体错误)
# 两器: 初始化器, 优化器
# 准确率计算

<<图计算>>
# 运行两器
# 获得准确率
# summary Writer for TB
# 绘图
 1: import tensorflow as tf
 2: from tensorflow.examples.tutorials.mnist import input_data
 3:
 4: # 载入数据
 5: mnist = input_data.read_data_sets("MNIST", one_hot=True)
 6:
 7: # 设置批次大小
 8: batch_size = 100
 9: # 计算共有多少批次
10: n_batch = mnist.train.num_examples // batch_size
11:
12: # TB:想在TB把某几个node放在一起显示为一个整体模块, 要把他们置于一个命名空间
13: with tf.name_scope('input'):                            # (name_scope)
14:     # 定义两个 placeholder <<< 需要调整到 name_scope 下
15:     x = tf.placeholder(tf.float32, [None, 784], name='x-input')
16:     y = tf.placeholder(tf.float32, [None, 10], name='y-input')
17:
18:
19: # TB:想在TB把某几个node放在一起显示为一个整体模块, 要把他们置于一个命名空间
20: with tf.name_scope('layer'):
21:     # 创建简单神经网络(无隐藏层)
22:     with tf.name_scope('wights'):
23:         W = tf.Variable(tf.zeros([784, 10]), name='W')
24:     with tf.name_scope('bias'):
25:         b = tf.Variable(tf.zeros([10]), name='bias')
26:     with tf.name_scope('score'):
27:         score = tf.matmul(x, W) + b
28:     with tf.name_scope('softmax'):
29:         prediction = tf.nn.softmax(score)
30:
31: # 二函,二器
32: init = tf.global_variables_initializer()
33: optimizer = tf.train.GradientDescentOptimizer(0.2)
34: loss = tf.reduce_mean(tf.square(y-prediction))
35: train = optimizer.minimize(loss)
36:
37: # 预测对错存在一个向量中
38: correct_prediction = tf.equal(tf.argmax(y,1), tf.argmax(prediction, 1)) # (count correct prediction)
39: # 计算准确率
40: accuracy = tf.reduce_mean(tf.cast(correct_prediction, tf.float32))
41:
42: # 图计算
43: with tf.Session() as sess:
44:     sess.run(init)
45:     # TB: 这里需要添加一个 writer
46:     writer = tf.summary.FileWriter('/home/yiddi/git_repos/on_ml_tensorflow/logs/', sess.graph) # (writer)
47:     writer.close()
48:     # 采取训练一轮就测试一轮的方式
49:     for epoch in range(2):
50:         # 训练模型
51:         acc_train = 0
52:         for batch in range(n_batch):
53:             batch_xs, batch_ys = mnist.train.next_batch(batch_size)
54:             _, acc_train = sess.run([train, accuracy], feed_dict={x:batch_xs, y:batch_ys})
55:
56:         # 测试模型
57:         # 测试集必须使用已经训练完毕的模型
58:         acc_test = sess.run(accuracy, feed_dict={x:mnist.test.images, y:mnist.test.labels})
59:         print("Iter " + str(epoch) + " ,Train:" + str(acc_train) + " ,Test:" + str(acc_test))

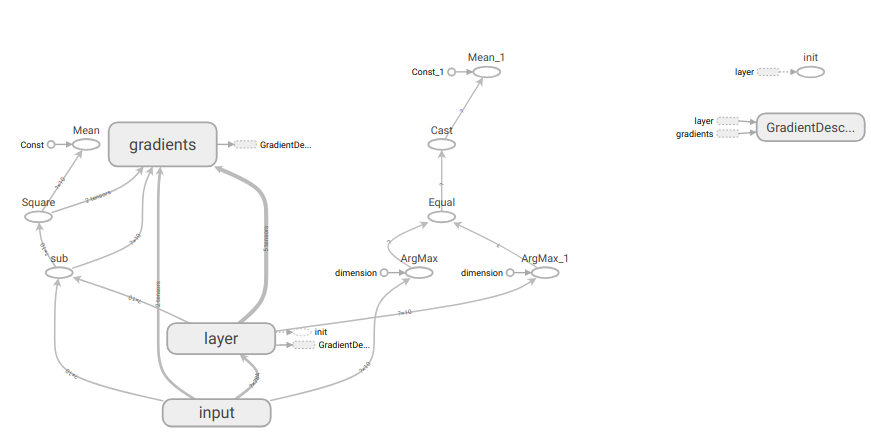
TensorBoard使用第一步就是要建立一个命名空间, 其下定义placeholder, 并且赋名.
                             文件夹位置
                               -------
writer = tf.summary.FileWriter('logs/', sess.graph) (writer)
                                        ----------
                                        本对话所计算的 graph 对象引用
当你第二次次运行的你 NN 代码的时候, 第一次的 graph 可能还存储在内存中. 这时候使用 TensorBoard 去观察是两张图叠加到一起的结果.
为了防止图被重复的载入内存, 应按照如下步骤运行:
# 1. <<get-pid>>
# 2. <<kill-pid>>
# 3. <<del-graph-summary>>
# 4. build, compute graph and write it into summary file
# 5. <<run-tensorboard>>
TODO: It's better to give a :var to get-pid which represent the session name
of python src block which used to build and compute graph
ps -aux | grep "python" | grep -E "(lec4|tensorboard)" | grep -v "grep" | awk '{print $2}'
| 17474 |
| 17480 |
TODO: 这个 kill-pid 只能接受 sequence 类型不能接受单体, 修正使其可以接受单体.
(defun r1l(tbl)
  (mapcar (lambda (x) (number-to-string (car x))) tbl)
  )
(mapcar #'shell-command-to-string
        (mapcar (lambda (x) (concat "kill " x)) (r1l pid))))
rm -rf /home/yiddi/git_repos/on_ml_tensorflow/logs/*
ls /home/yiddi/git_repos/on_ml_tensorflow/logs
run shell command below in a async manner, the predefined argument ":async t" not avaiable for shell
tensorboard --logdir=/home/yiddi/git_repos/on_ml_tensorflow/logs
注意 org babel 运行结果如果是一个 table 的话, 每一行作为一个 list, 所有行再组成
一个 list, 所以每一个 table 都是二维 list

| 29968 |
| 29973 | ===> ((29968)(29973))


|  29968 |   2342 |
|  29973 | 234234 | ===> ((29968 2352)(29973 234234)(234234 121))
| 234234 |    121 |
TODO: org babel + yasnippet + org table 可以做的事情简直太多了, 比如这种
for i in range(30):
    <<src-block-name>>
可以把这种模式应用到对整个 ML 代码架构的定义和组织上.
比如 table 是可以放置代码名字在上面的, 而且支持 spreadsheet, 可以形成一个 table:
| 参数1 | 参数2 | 参数3 | … | loss | acc_test | acc_train |
|---|---|---|---|---|---|---|
table ===> 散点图(elisp or python 都可以 用来绘制 acc-test acc-train 关系图) 等等, 甚至还可以写程序根据两者数据的趋势自动调整参数,之后再进行训练.
      自动调参, 自动训练, 自动绘图 ->-+
         ^                            |
         |                            |
         +----------------------------+